

Traditional business analytics has undergone significant changes thanks to the internet revolution, cloud computing and the shift to self-service analytics, contributing to the recent rise of embedded analytics in business operations. Embedded analytics involves embedding and integrating visualizations, dashboards, reports or predictive analytics in everyday business applications.
In other words, the digital age has ushered in a new era where consumers crave additional information and hold higher expectations. Management seeks quick responses and analysts demand immediate access to data without any delays.
Companies depend on different software and capabilities to perform business analytics. To create a dashboard manually, professionals may need to open individual HR, CRM, BI and data visualization software separately.
When these dashboards are all integrated into a single surface, business leaders are finding that analysis becomes more accessible and fluid for users, increasing efficiency in scores of workflows along the way.
This article will explore two of the most prevalent real-world applications of embedded analytics in banking by exploring two use cases:
- Eliminating data silos: Adopting embedded analytics to break silos of technology and data to obtain more in-depth business insights and meet cross-organizational data demands.
- Creating interactive dashboards: Increasing customer engagement by providing customers with interactive dashboards to explore their data in fine detail.
Use Case #1: Eliminating Data Silos
Data silos occur when data is stored in separate systems or departments, making it difficult for different teams to access or share information. These silos can lead to inefficiencies, errors, and missed opportunities.
Data silos make it impossible to enrich the data, and hence it impacts negatively on the decision making. For example, in a SaaS (Software as a Service) company, the definition of an active subscriber can vary between the finance and marketing teams.
The finance team considers a subscriber active if they pay a subscription fee or utilize a promotion. On the other hand, the marketing team defines active status based on a range of platform activities, such as logging in and engaging in various actions. This discrepancy results in inefficiencies and the need for extra effort to ascertain the accurate source of information.
Embedded analytics can help to remove data silos by providing users with a unified view of data from different sources. By integrating analytics directly into existing applications, users can easily access and analyze data from different systems without complex integrations or migrations- making it easier for other teams to collaborate and share insights, leading to better decision-making and improved business outcomes.
Thus, embedded analytics can help organizations to break down data silos and create a more data-driven culture where data is easily accessible and used to drive insights and innovation.
Vendor example: Salesforce CRM Analytics (formerly Tableau CRM)
Salesforce, a software development company, provides embedded analytics capabilities with its product- CRM Analytics. The company claims that this software can help you capture actionable insights inside the CRM, discover the story the data tells and visually distinguish where the enterprise needs to go. It also provides visualization and predictions to support the data-based decision.
CRM Analytics works in four layers:
- Data management: Provides tools to connect and clean all kinds of data.
- No code AI- Provides predictions, recommendations, and narrative explanations of data.
- Discovery and analytics studio- Provides capabilities to build AI-powered applications or pre-build templates.
- Intelligent experiences- Provides capabilities to engage, collaborate and act on data insights with proactive alerts and notifications.
Royal Bank of Canada (RBC), a Canadian multinational financial services company, operates in private client groups with more than 2100 advisors as well as clearing and custody services groups with 300 independent brokers in the US.
Per the case report published by Tableau, the bank was continuously receiving low rankings for technology. Because of this lag, the bank was losing its potential advisors.
The case report also mentioned that the bank’s technology stack was a mix of legacy and new systems and applications across operational, business and compliance groups with strict regulations and oversight requirements.
The bank moved the technology under one group to address this challenge. The goal was to remove the data silos across the teams to deliver a consistent real-time user experience for everyone.
RBC adopted CRM Analytics (formerly known as Tableau CRM) with Salesforce Cloud. The built-in connectors and integrations helped the company bridge the data gaps in legacy systems and multiple platforms.
The demo for CRM Analytics can be found in this video below at 42 minutes 40 seconds.
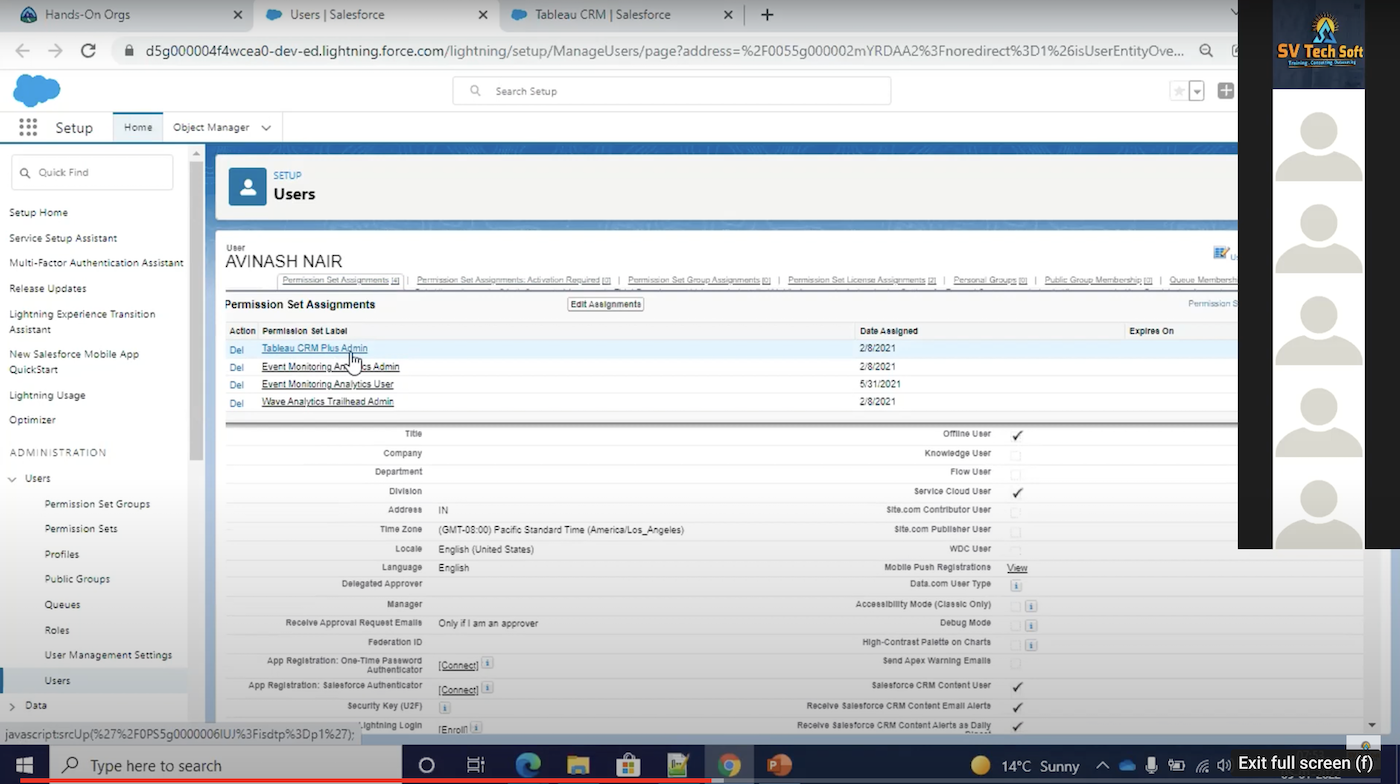
A screenshot of CRM Analytics’ users dashboard. (Source: SV Tech Soft)
The company claims that RBC achieved the following benefits:
- Creating a single source of truth
- building dashboards and creating a better experience
- Reduced 26 different data sources to few clicks in CRM Analytics
- Made a single view of client data with analytics
- Integrated Salesforce, Tableau and CRM Analytics to meet cross-organizational data demands.
The case study report also features prominent video testimony from RBC Wealth Management Head of Technology Greg Beltzer about how embedded analytics helped the team with real-time data and analytics, making attending unexpected calls from clients easier.
Salesforce also claims that its embedded analytics provides
- 22 percent decrease in time to resolve cases
- 25 percent increase in business because of quality
- 27 percent more strategic data-driven decision-making
Use Case #2: Creating Interactive Dashboards
Banking relies heavily on data, and real-time data analysis is essential for making informed decisions. Interactive dashboards and visualization tools allow bankers to analyze data in real time, providing them with up-to-date insights that they can use to make more informed decisions.
Interactive dashboards can help banks identify potential risks and proactively mitigate them. The survey done for the research on “the effect of interactive analytical dashboard features on situation awareness and task performance” indicated that the interactive analytical dashboard showed significantly higher task performance.
Embedded analytics can help create interactive dashboards by providing real-time data analysis and visualization capabilities within the context of existing workflows and applications.
Vendor Example: Sisense
Sisense – a software development company in New York, provides embedded analytics capabilities through its product – Sisense Fusion Embedded Analytics. The company claims this platform can help secure analytics in a flexible environment and deliver a consistent brand experience.
This platform can run on any device, including mobile, desktop and laptop, and can also source data from relational databases such as:
- SQL Server, MySQL or Oracle
- Spreadsheets and files like Excel, Google Sheets, or CSV
- Web applications like Google Analytics, Adwords, Zendesk Salesforce, and Hadoop Big Data.
Orion is a financial services company whose 950+ clients manage assets of USD 375 billion. While the number was lucrative, the static reporting solution needed to be improved.
Per the case report– the challenge was that the traditional reporting solution served basic dashboards. The company’s customer needed help to track back the origin of the data to understand the trends and analysis. However, this was not possible with their current analytics solution.
Additionally, Orion’s platform gathers and analyzes data on client investments, allowing them to view their performance. Though this platform was customizable and flexible, it was slow and the data was static. The customers demanded more dynamic and interactive dashboards.
The company adopted Sisense’s embedded analytics platform to address the above challenge.
Starting at the 13-minute mark, this video gives a full demonstration of Sisense Fusion Embed Analytics software and its workflows.
The report also mentions that advisors at Orion can better monitor business trends, zoom into the details, and address questions regarding Assets Under Management (AUM) changes over time, new accounts opened by month/year/quarter, transaction types, top performers, cash flows, demographic trends, and more.
Previously, Orion’s customers needed help understanding the origins of the summarized data in their monthly reports. However, after implementing changes, the company claims that they could trace the data’s journey from its source, enabling them to gain precise insights into the events. As a result, end users can now investigate and clarify any unexpected findings, revealing invaluable insights in the process.
In the nearly one-and-a-half-minute-long video below, Malinda Jepsen, Business intelligence specialist at Orion, discusses how embedded analytics helped streamline workflows at the company:
The case report also claims that adopting Sisense’s embedded analytics platform helped Orion:
- Clear the 500 GB data clogging their SQL Server
- Achieve a 98 percent adoption for the new interactive dashboards for Orion’s client


